


Detect condition
A clear dashboard bundles released status displays and warnings.
Graphics and clear key figures make operational monitoring clear. Authorized management of an animal husbandry facility can view released parts of this monitoring and the performance of the system.
All values shown are fictional and are for illustration purposes only.
Function example with synthetic data
A clear dashboard bundles released status displays and warnings.
Time curves show response times and the volume of requests in the selected time period.
The facility management receives insight into released information. Scope and access depend on role and agreed release.
A shared insight for management: system states, request volume and response times with synthetic metrics.
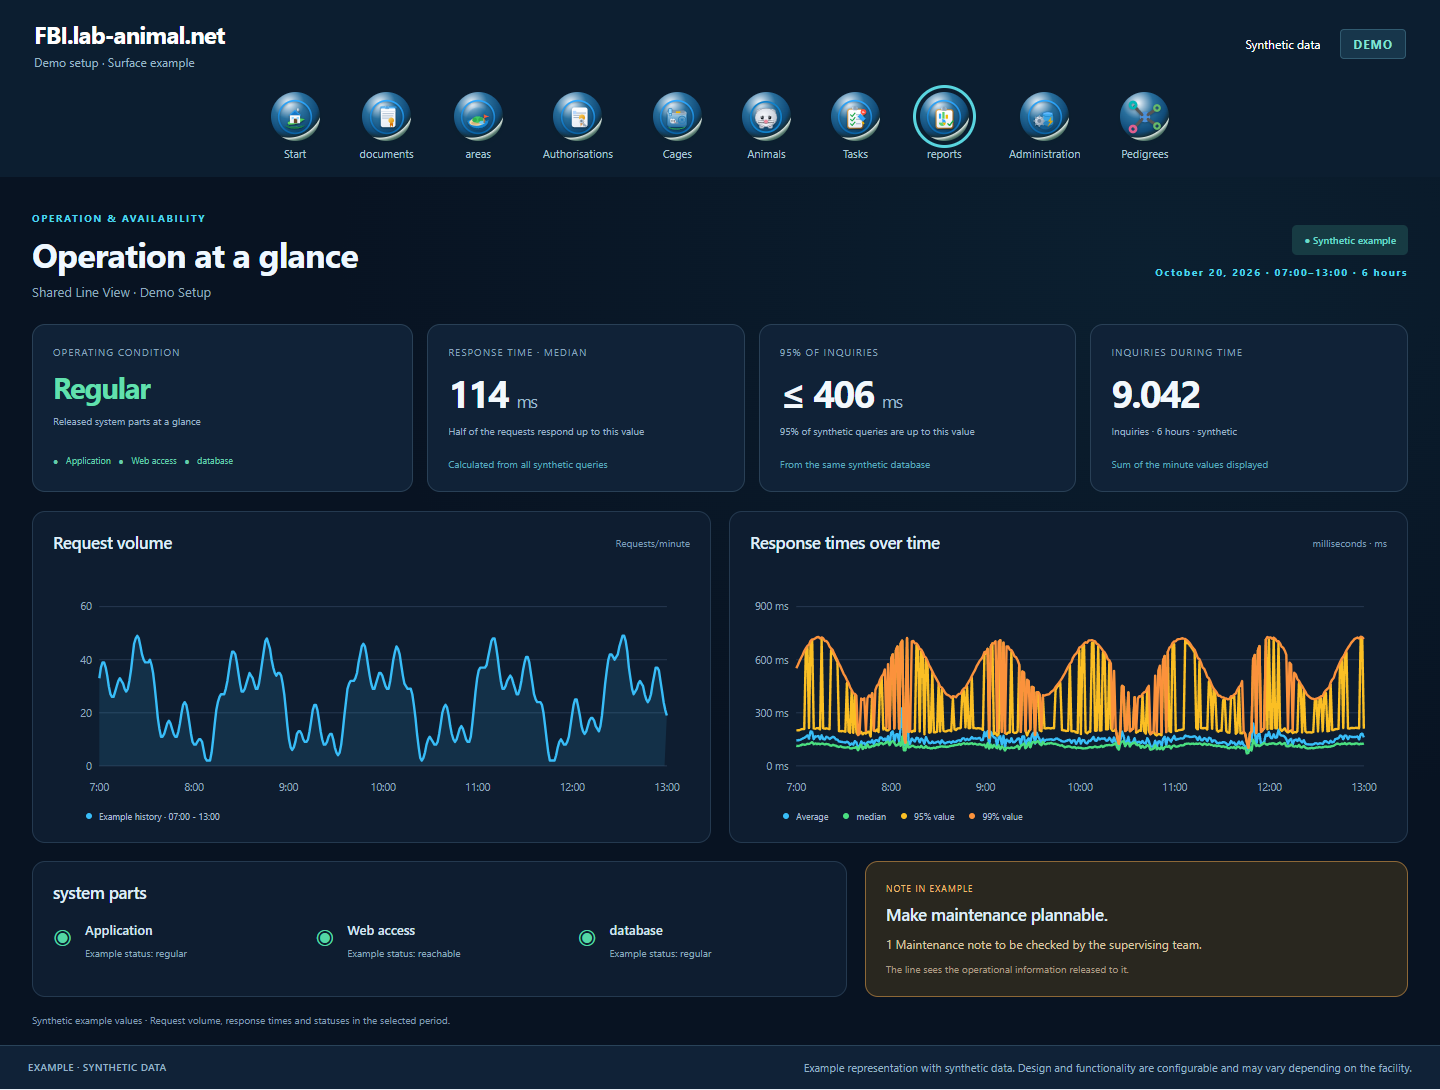
Operational monitoring complements our recommended “trouble-free” solution: We take care of ongoing maintenance, protection and availability, while you can understand the approved operating status.
Always read key figures with the period under consideration.
View released system parts, notes and warnings together.
Classify trends and peaks in connection with the volume of inquiries.
If there are any abnormalities, clarify the necessary steps with the supporting team.
Authorized facility managers see released operating states and performance data. Graphics and key figures supplement the insight into the operations we support.
Authorized facility management receives access to released operating and performance data. The scope depends on the role and agreement.
Inquiry volume and response times can be tracked in the selected period. Status displays and notes complete the overview. The values shown are synthetic examples.
In the supervised operation, we take care of ongoing maintenance, protection and availability. Internet access is available 24 hours a day and can be restricted upon customer request.
Yes. The entire application engine can also be operated by the customer. We agree on the requirements and operational responsibilities together.
Example representation with synthetic data. Design and functionality are configurable and may vary depending on the facility.
Together we will clarify what scope suits your facility and what the introduction can look like.
Let’s talk